Identify Trend With Candle Stick Pattern, Japanese Candle Sticks Explained Visually
Basics of Japanese Candlesticks Charts
Candle Sticks aids in helping market situation efficiently, one advantage it has over other visual methods is, it is more visually depicting than in numbers, hence once learned it can help you find patterns more easily, this may not help you make the trade, but it sure will help you get a grasp on what’s going on the market, hence it helps you to make a wise decision.
To understand it would be good to look at the basic structure of a candlestick to understand what’s being written in each pattern’s analysis.
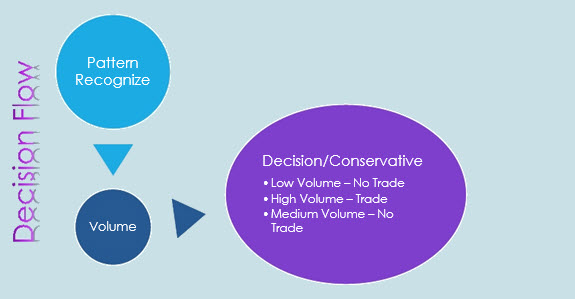
What to Do with Real-time Chart in NSE, MCX & FOREX?
- Learn
Each pattern requires a different type of action from your end. - Recognize
Learn to recognize different patterns in live market - Volume
Check volume to ensure the pattern is backed by activity - Apply
Take decision based on the pattern recognized
Anatomy of Candle Sticks in Live Chat
It is important to understand the different parts of candlesticks. Because certain candlestick patterns have only subtle changes. So, sometimes if overlooked two patterns can seem very similar. So, look for the tiny details like, how long is the tail, where the real body ends.
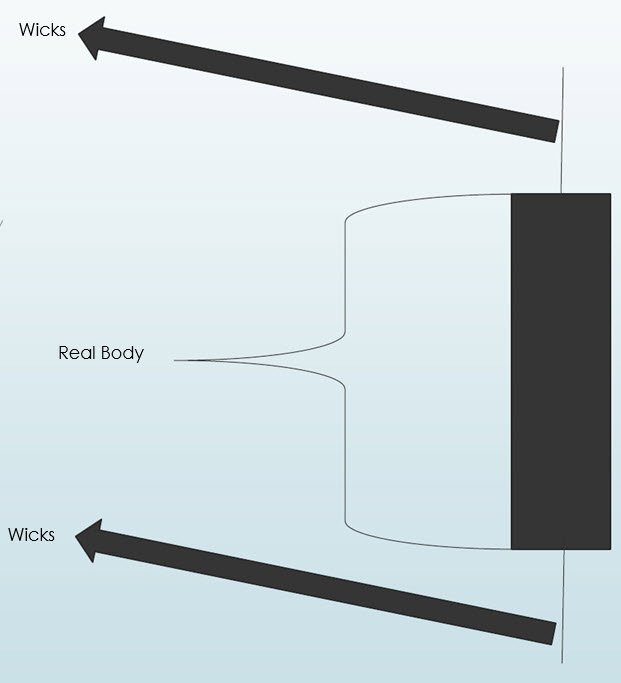
Basic of Japanese Candlesticks in your Chart
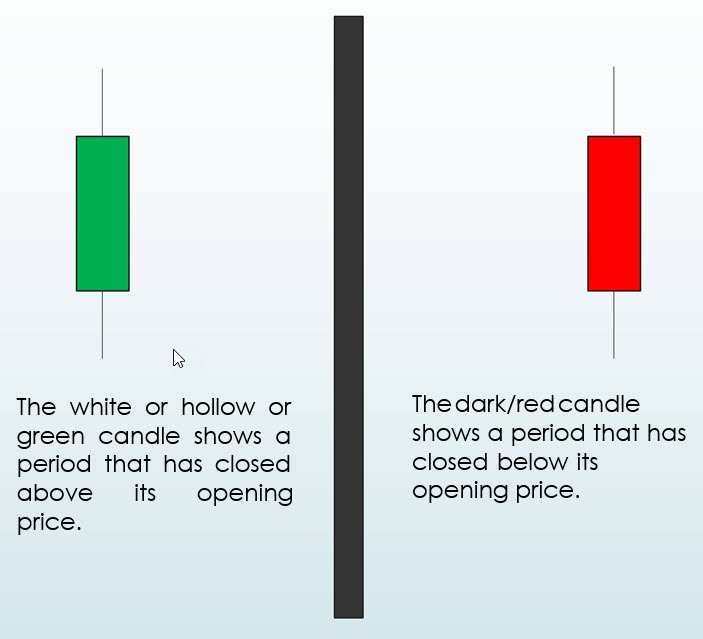
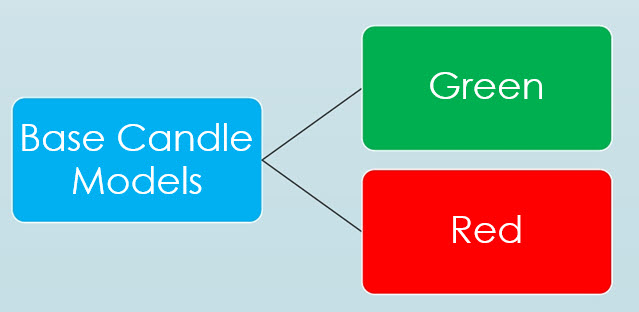
The Difference Between The Base Candles
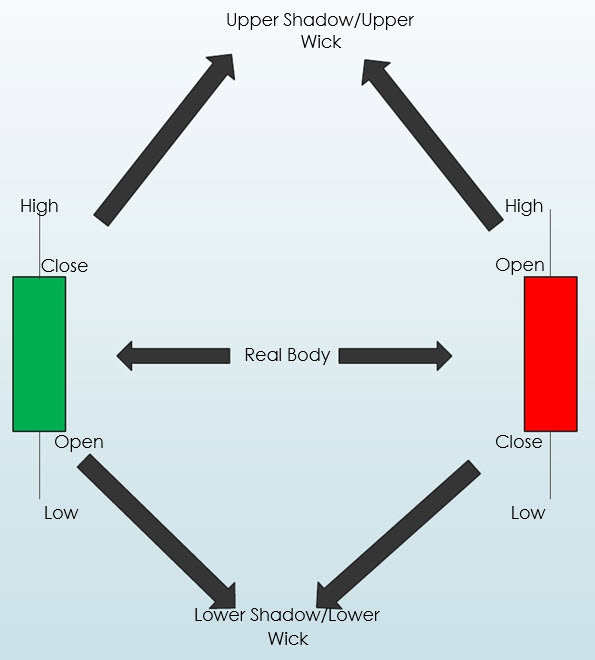
- The fat part of the candle is called the real body.
- The two thin lines above and below are called wicks or tails.
- The main difference for each type of candle occurs in the price they open and close. The high and low points remain same for both type of candles
Why Candle Sticks in your Metatrader 4 Charts?
- It helps to view the market in a visual language, the continuous pattern of a single type of base candle will help us a sense, who is putting more pressure on the market.
- There are many indicators that are available in the stock market, but there is nothing like a candlestick in your MT4 real-time chart, which is a visual representation of what is happening in the actual market.
- Fundamentally, what you are doing here is pattern recognition, candlestick ease the process with a visual representation of data, thus we as humans tend to easily grasp visual cues than cues based on pure numbers.
Different Types of Japanese Candlesticks in your MT4 Charts
Marubozu (Bullish / Bearish)
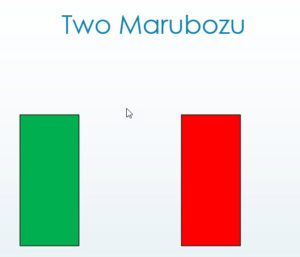
- A Marubozu candlestick has no upper shadow and now lower shadow. A white marubozu opens at its low and closes at its high. A dark marubozu opens at its high and closes at its low.
- The green marubozo clearly shows bulls are in control
- The red marubozo clearly shows bears are in control.
- Marubozu is a Japanese word or Dominance
- These are extremely powerful candles
- Can be a trend-reversal or trend-continuation candle
- A Marubozu with higher volume is more powerful
Spinning Tops
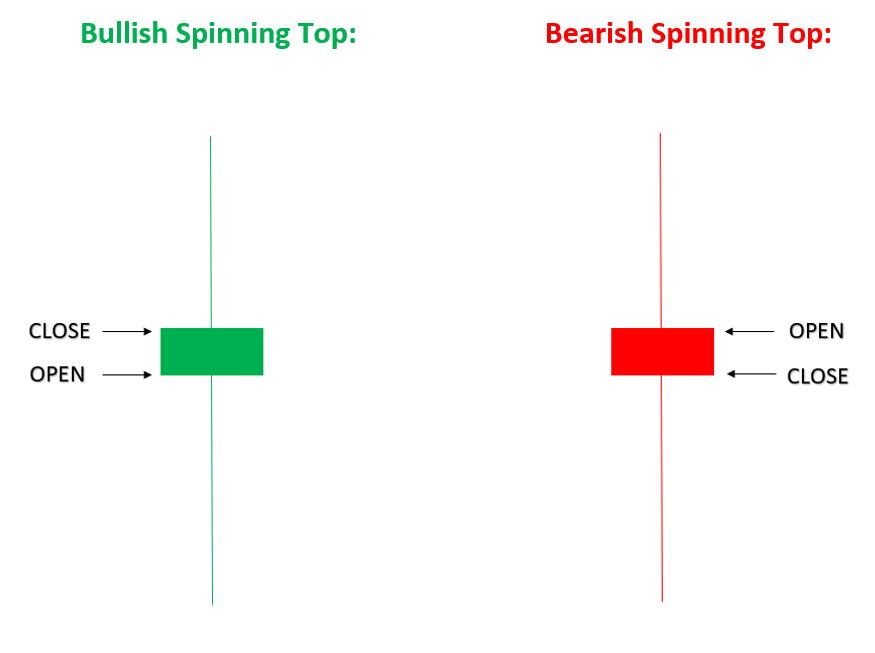
- These candle formations show that either party had a slight advantage during the time frame.
- If the final candle formed during the time period is green it means, bulls had a slight power overbears, if red it means the other way.
- The trend is losing its force
Doji Candle Sticks
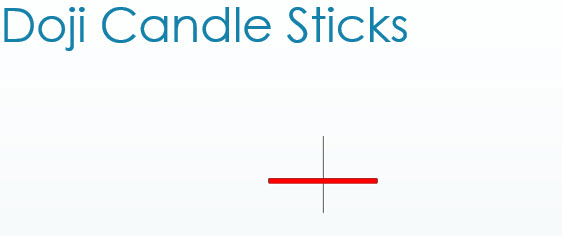
- These Doji Candlesticks show an even more extreme version of what we saw in the spinning tops above. Here we have very long upper and lower shadows and teeny little real bodies with the close virtually AT the opening price.
- Whether the close was up (white) or down (dark) isn’t what’s most notable here.
- What’s important is that there was a battle that extended far above and below the open, with one side gaining some large advantage within the candle and then giving it up and retreating just as far in the other direction, before fighting back to a standoff.
- Doji Candlesticks can often portend a trend reversal, especially if put in on heavy volume. But again, we’re getting ahead of ourselves. Just file that in the back of your mind and we’ll pick it up again later in this section.
- There are different types of Doji Candle Sticks.
1. Dragon Fly Doji
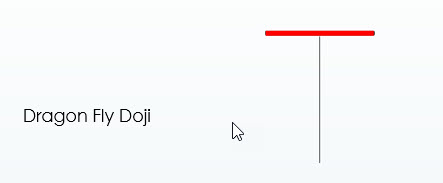
Dragon Fly Doji can appear at either the top of an uptrend or the bottom of a downtrend and signals the potential for a change in direction. Works well in depicting Bullish Signals
2. Standard Doji
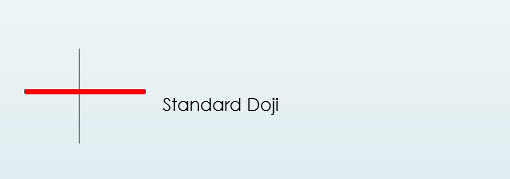
Does not signify anything, check the previous trend.
4. Gravestone Doji
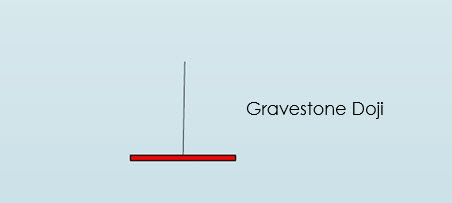
Works well in signaling bearish signals
4. Long Legged Doji
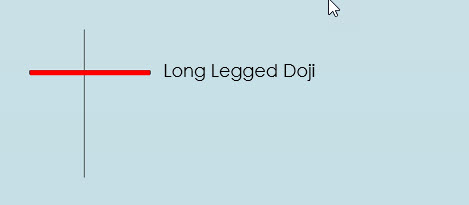
This shows the indecision between the buyers and the sellers.
Hanging Man or Hammer
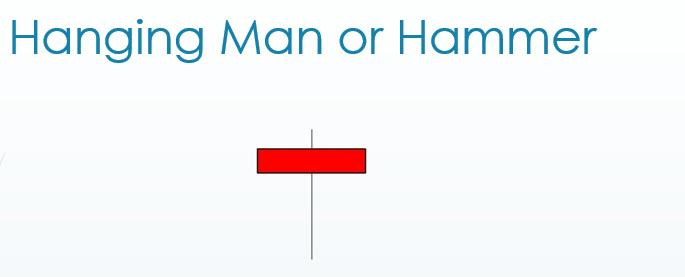
- The red candle above shows that a lot of the session’s action took place far below the opening price and the bulls fought back and closed the session just a bit below the open.
- If this sort of candle shows up in a sustained uptrend, it may signify a weakening of the bulls and it would be called a Hanging Man. (It looks like a man hanging by the neck.).
- If we see the same candle after a sustained downtrend, it could signify that, while the bulls have not overwhelmed the bears, they have (perhaps for the first time in a while) fought back hard enough to cause downward momentum to abate. In this context, the candle is called a Hammer (as in hammering out a bottom and you can see it as looking like a hammer).
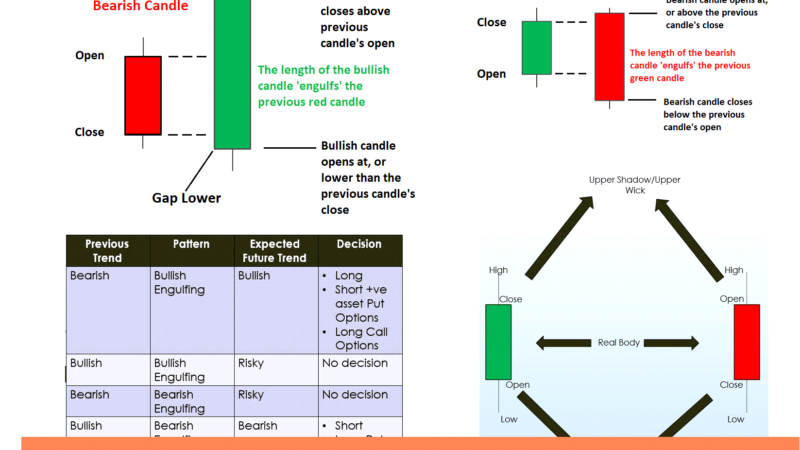
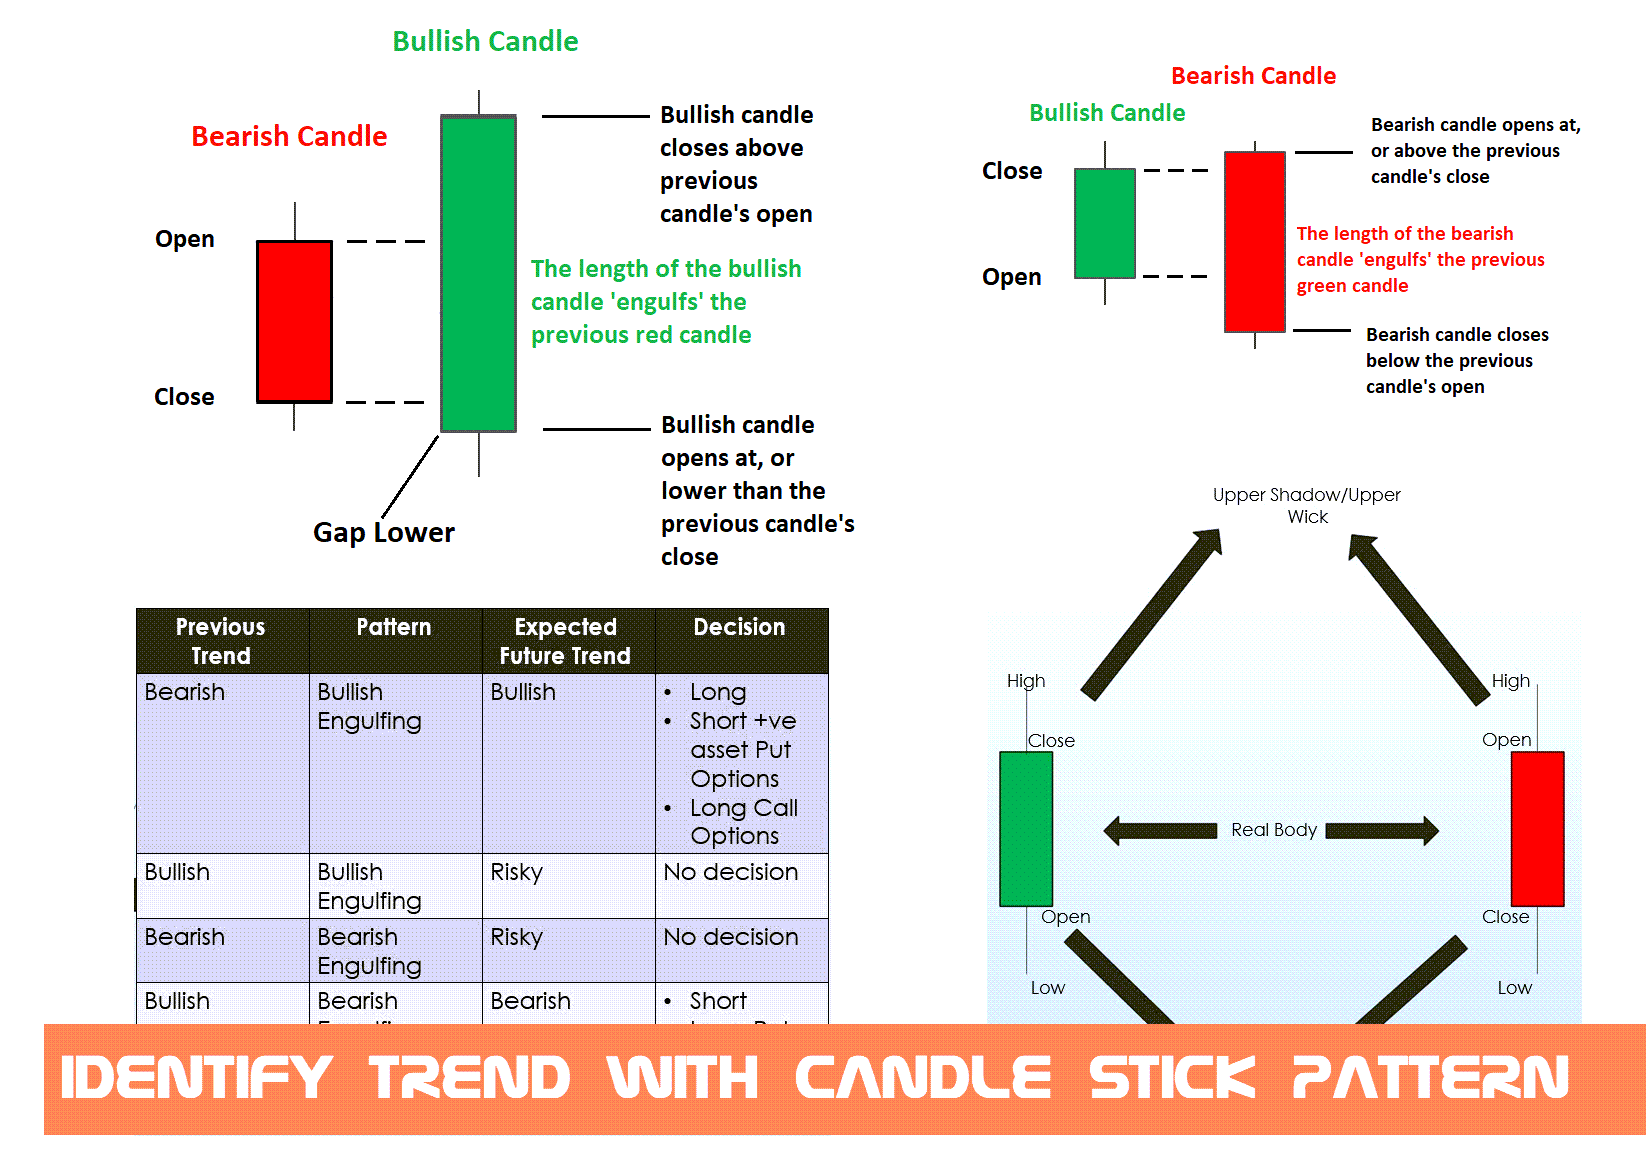
Engulfing Patterns
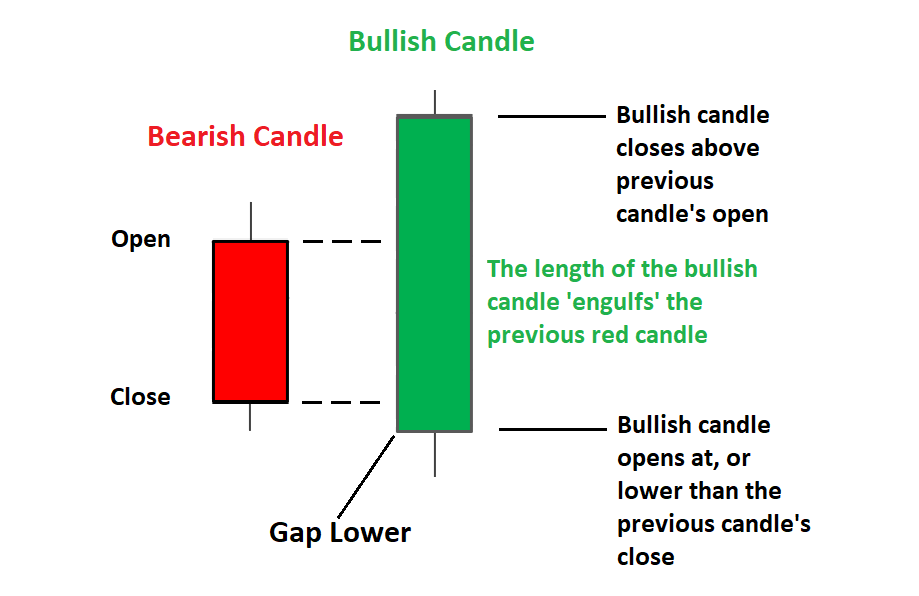
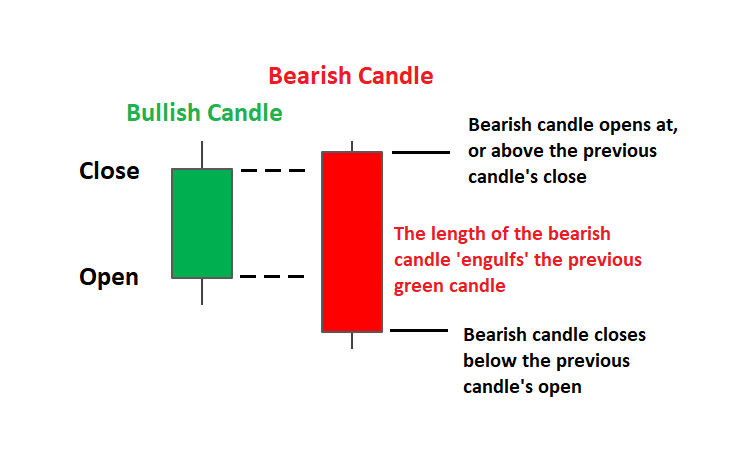
The relative size of the bodies in the first and second days is important. If the first day of the Bullish Engulfing Pattern is characterized by a very small real body (it may even be a Doji or nearly a Doji) but the second day is characterized by a very long real body, this strongly indicates that the bearish power is diminishing and the disparity of white versus red body is indicative of the emerging bull power. There is a higher probability of a bullish reversal if there is a heavy volume on the second real body or if the second day of the Bullish Engulfing Pattern engulfs more than one real body (which essentially means we see two or more small red bodies preceding the long green body). The reversal of the downtrend needs further confirmation on the third day. This confirmation may be in the form of a green candlestick, a large gap up, or a higher close on the third day.
Bullish Engulfing Pattern is a pattern characterized by a large green real body engulfing a preceding small red real body, which appears during a downtrend. The green body does not necessarily engulf the shadows of the red body but totally engulfs the body itself. The Bullish Engulfing Pattern is an important bottom reversal signal.
Engulfing Pattern Decisions
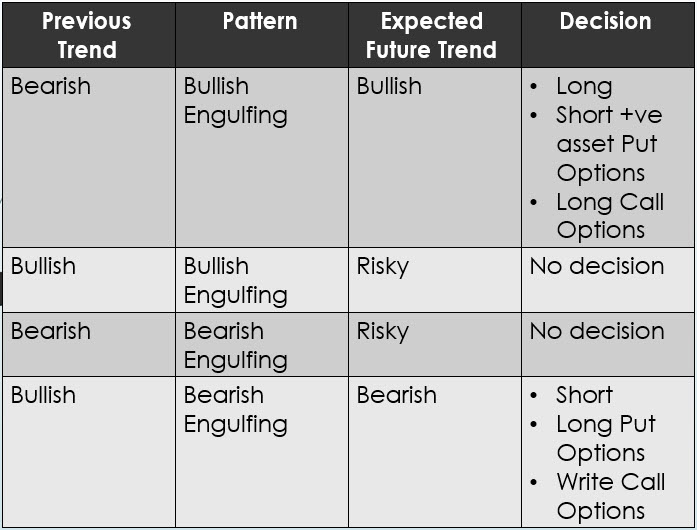
While the market sentiment is bearish; we see some subsided selling reflected by the short, red real body of the first day. Next day shows bull strength with a closing price at or above the previous day’s open. It means that the downtrend is now losing momentum and the bulls started to take the lead.
Dark Cloud
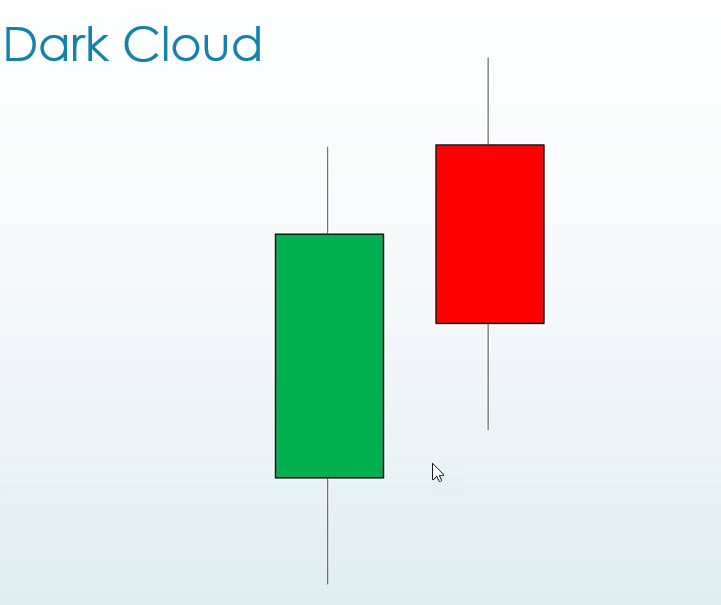
The market goes up with an uptrend. Then we see a strong white candlestick followed by a gap suggesting that bulls retain the control. However, the rally does not continue. The market suddenly closes at or near the lows of the day so the second-day body moving well into the prior day’s real body. Longs are shaken somehow and short sellers now have a benchmark to place a stop, which is at the new high of the second day.
- General narration
The market is characterized by an uptrend.
We see a long green candlestick in the first day.
Then we see a red body characterized by an open above the high of the previous day on the second day.
The second red candlestick closes within and below the midpoint of the previous green body. - Decision in market
The coming trend is bearish
Short
Sell call options
Buy put options
Piercing Pattern
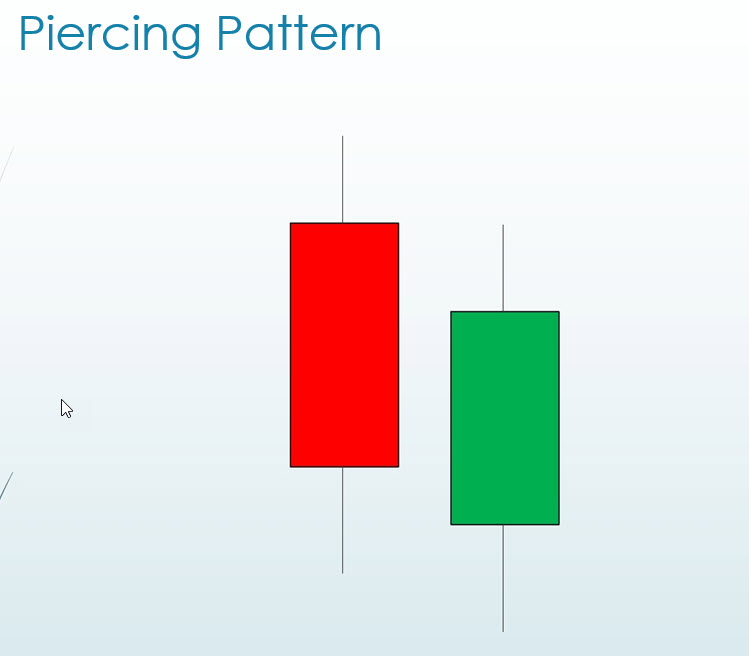
Bullish Piercing Line Pattern is a bottom reversal pattern. A long red candlestick is followed by a gap lower during the next day while the market is in a downtrend. The day ends up as a strong green candlestick, which closes more than halfway into the prior red candlestick’s real body.
The market moves down in a downtrend. The first red real body reinforces this view. The next day the market opens lower via a gap. Everything now goes, as bears want it. However, suddenly the market surges toward the close, leading the prices to close sharply above the previous day’s close. Now the bears are losing their confidence and reevaluating their short positions. The potential buyers start thinking that new lows may not hold and perhaps it is time to take long positions.
Pattern of occurring
- The market is characterized by a downtrend.
- We see a long red candlestick.
- Then we see a long white candlestick whose opening price is below the previous day’s low on the second day.
- The second day’s close is contained within the first day’s body and it is also above the midpoint of the first day’s body.
- The second day however fails to close above the body of the first day.
Decision
- Long
- Short Put Options
- Buy Call options
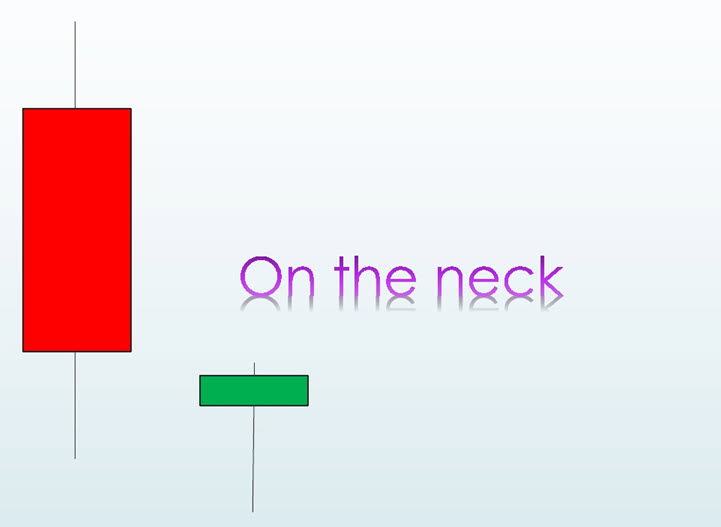
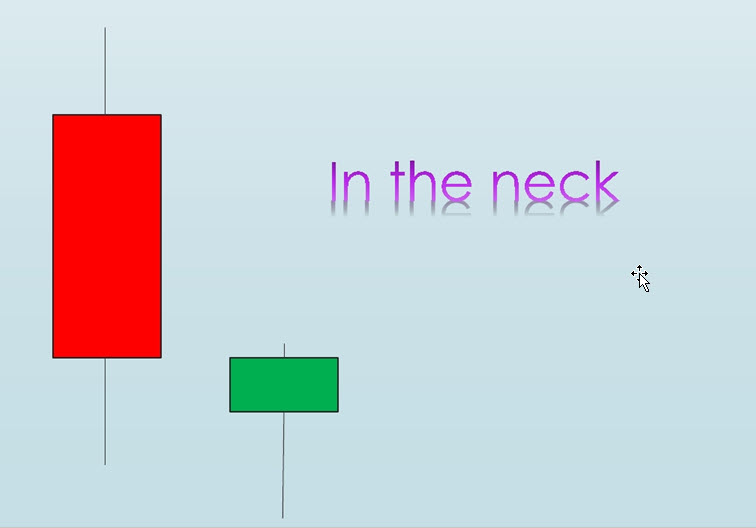
Neck Patterns
- On The Neck
2. In The Neck
3. Thrusting Neck

Analysis of the Neck Patterns
- The On Neck, In Neck, and Thrusting Patterns resemble the Piercing Pattern but don’t be fooled. They are somewhat bearish rather than bullish.
- They are not reversal candles, but I’ve included them here because they contrast so specifically to the piercing pattern and illustrate an important idea that pertains to “Fibonacci Retracements,”.
- The second candle of each of these patterns opens below the low of the first candle.
- The second candle of the On Neck is a short, green, and the closes near the low of its predecessor.
- The second candle of the In Neck Pattern is also green and closes slightly up into the real body of the first
candle of the pattern. - The Thrusting Pattern has a long white second candle, but that candle’s close is below the midpoint of the first candle.
- In all these cases we see a market that is unable to regain even half of the prior session’s loss. A move below the low of any of these three patterns is an indication that further weakness lies ahead.
- The most important thing to keep in mind here is that the midpoint of the first candle has proven to be resistance to further upside. That’s what makes them potentially bearish.
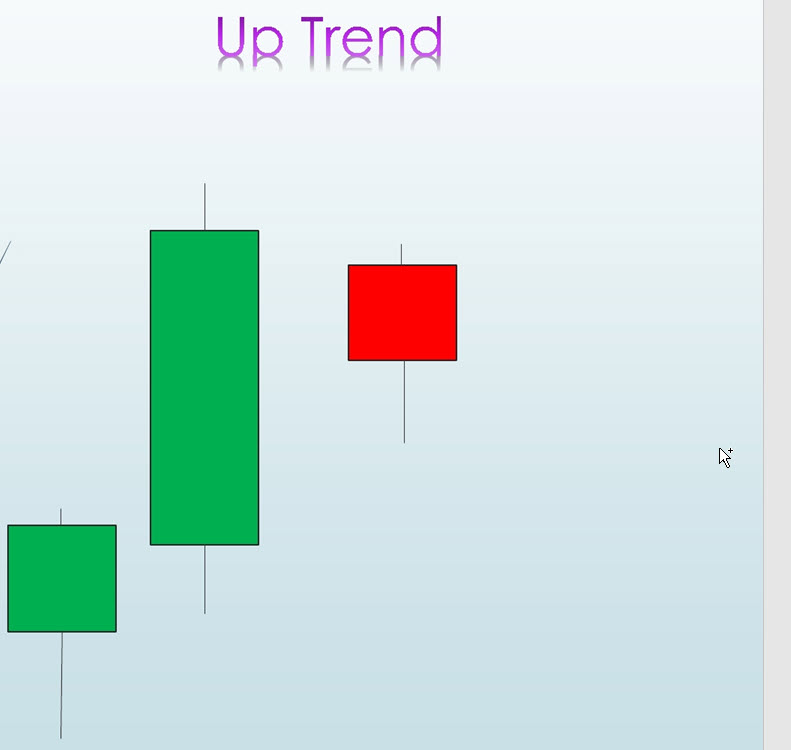
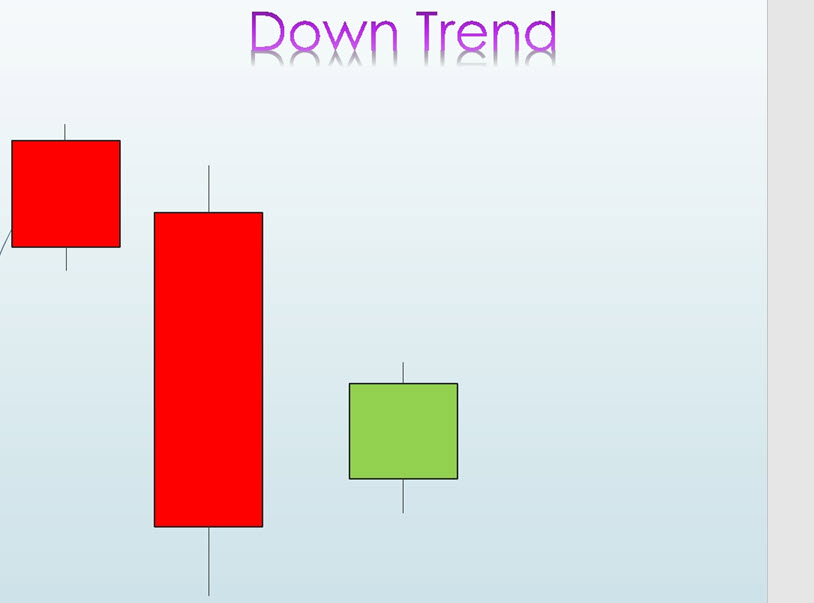
Harami Pattern
- Harami Up Trend
2. Harami Down Trend
3. Harami Cross
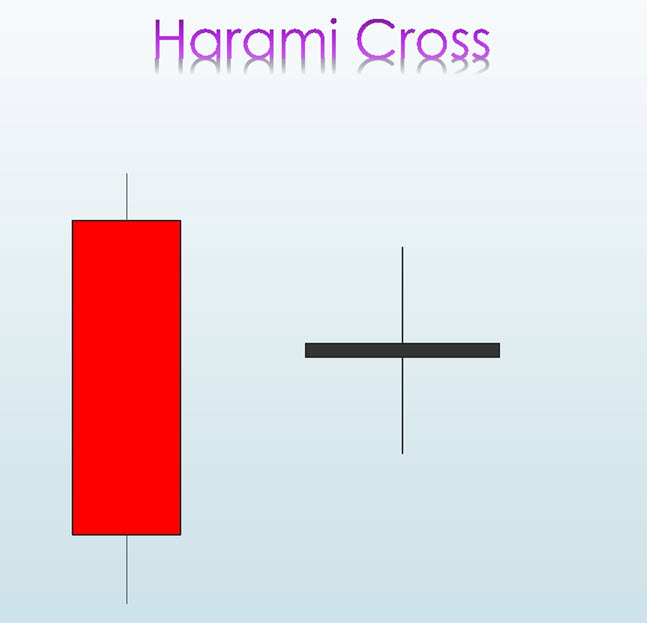
Harami Candle Sticks Analysis
Harami is an archaic Japanese word meaning “pregnant.” The Harami Pattern is formed when a longish candle that moves in the direction of an existing trend is followed by a candle with a small real body that is contained between the open and close of the longish real body. The long real body is the mother. It contains the small real body, the baby.
In an uptrend, a Harami Pattern tends to be bearish, while in a downtrend it tends to be bullish.
It may not be as powerful a reversal pattern as a hammer or an Engulfing Pattern and may signify that momentum will abate rather than strongly reverse.
The color of the “baby” may be either the same or the opposite of that of the “mother.” More often than not, though, it will be the opposite. Perhaps the most powerful sort of Harami Pattern is the Harami Cross in which the baby is a Doji candle.
The Harami Cross is considered to be a major reversal pattern because of the power of the Doji candle.
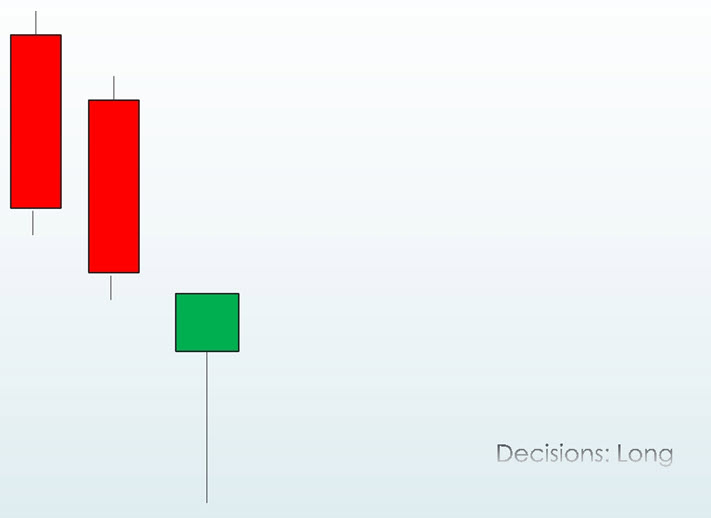
Bullish Shooting Star
Shooting stars are powerful patterns that shows a clear change in trend.
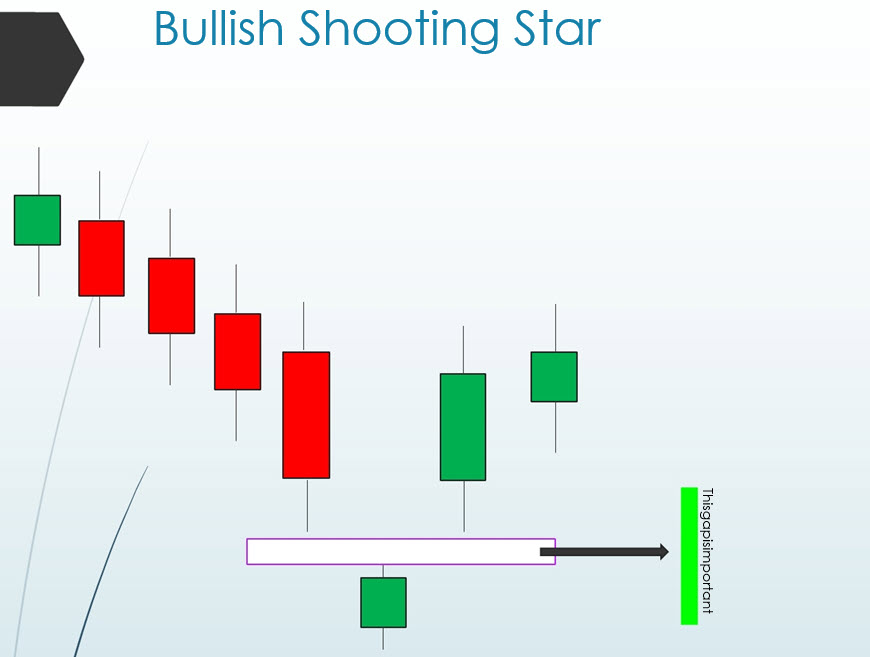
- Decisions: Long
- Buy Call Options
- Write Put Options
Bearish Shooting Star
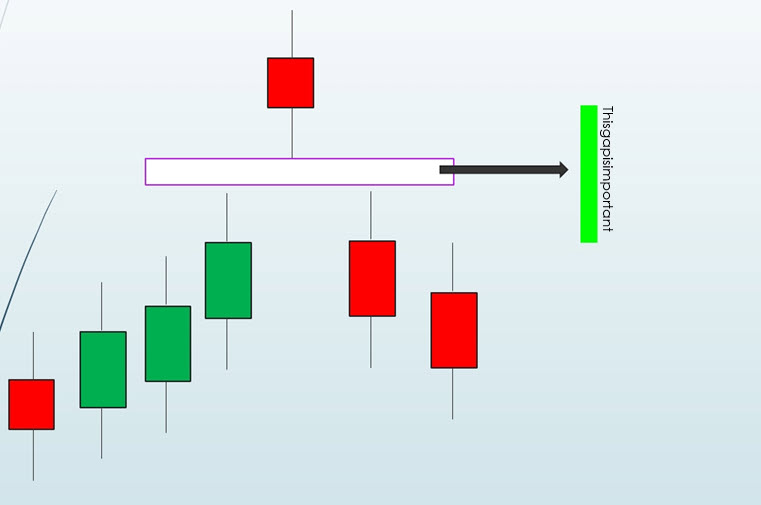
- Decisions: Short
- Sell Call Options
- Buy Put Options
Bearish Doji Star
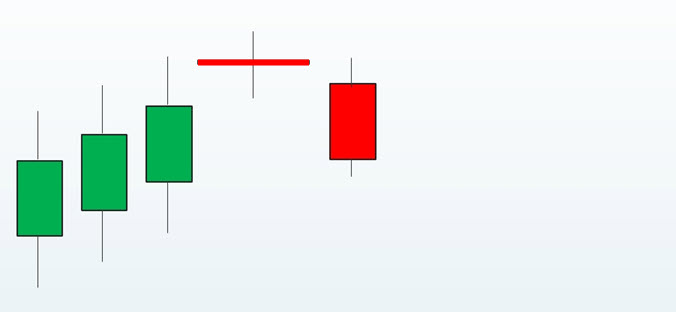
- Portrays: Upcoming Down Trend
- Decision : Short (Sell Call Options / Buy Put Options)
- Previous Trend: Bullish
Bullish Doji Star
- Portrays: Upcoming UpTrend
- Decision: Buy(Sell Put Options / Buy Call Options)
- Previous Trend: Bearish
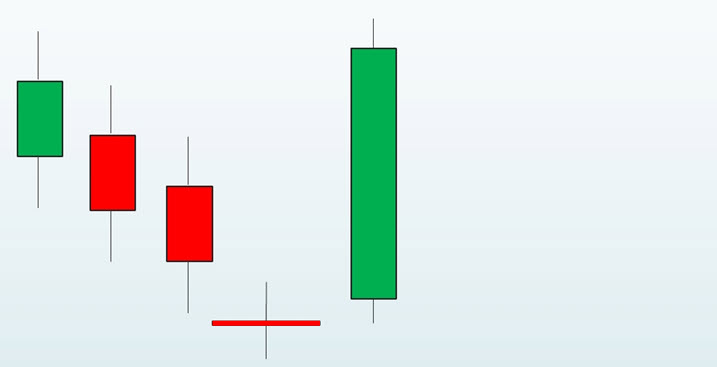
Rising Three
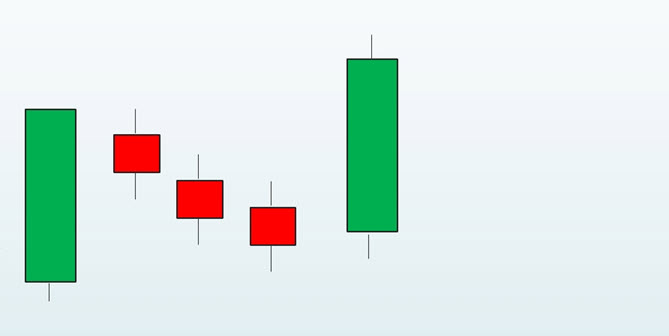
Slowly developing bullish trend
Decisions: Long on Assets (Sell Put Options)
Falling Three
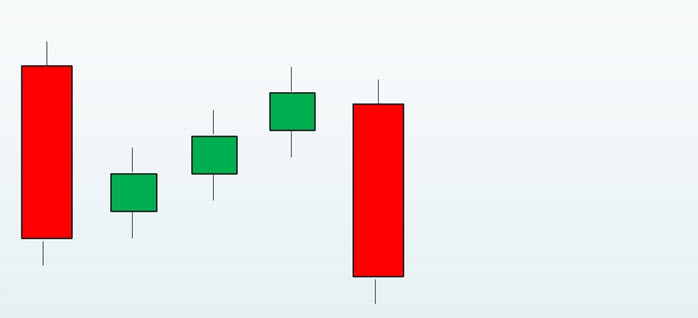
Slowly developing bearish trend
Decisions: Short on Assets (Sell Call Options)
Bullish Hammer
- The overall direction of the market is bearish, characterized by a downtrend.
Then the market opens with a sharp sell-off implying the continuation of the downtrend.
However, prices suddenly turn upwards, the sell-off is quickly abated and bullish sentiment continues during the day with a closing price at or near to its high for the day which causes the long lower shadow.
Apparently, the market fails to continue in the selling side. This observation reduces the previously bearish sentiment causing the short traders to feel increasingly uneasier with their bearish positions.
General Depiction
- The market is characterized by a prevailing downtrend.
- Then we see a small real body at the upper end of the trading range. The color of this body is not important.
- We would like to see the lower shadow at least twice as long as the real body.
- There is no (or almost no) upper shadow.
Aligning Volume
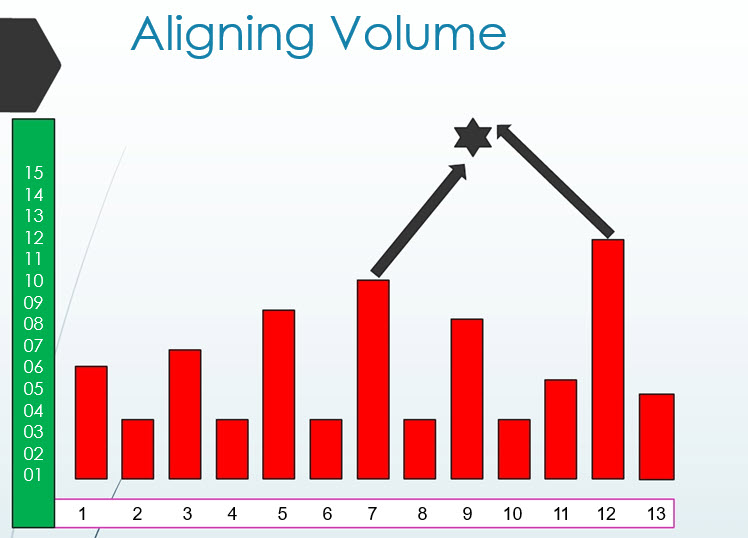
Once the pattern is recognized compare the volume on the time when the pattern occurred, if it is not standing out, abort any further decisions.
There is no easy way to do this. Volume looks different for every other assets. But you can choose the standing out one by depicting the volume underlay charts.
In the above example
- X axis shows Time line
- Y axis shows Volume , of an asset we are candle charting.
- Decision making
• Here in the depicted timeline, comparing the volume we can see that only two points, Timeline 7 and 12 stand out prominently.
• So, when applying any candlestick pattern found, make sure that the recognized pattern is on these prominent volumes.